Available as a Jupyter notebook here
Receptor-ligand interactions in human primary cells
Ramilowski et al (10.1038/ncomms8866) have a very nice resource on receptor-ligand interactions in human primary cells. Let’s explore…
%pylab inline

import matplotlib.pyplot as plt
import numpy as np
import pandas as pd
import seaborn as sns

sns.set_style("white")
plt.rcParams['svg.fonttype'] = 'none'
Populating the interactive namespace from numpy and matplotlib
# Read in the supplementary material
df = pd.read_excel(
    "https://images.nature.com/original/nature-assets/ncomms/2015/150722/ncomms8866/extref/ncomms8866-s3.xlsx", 1)
df.head()
| Pair.Name | Ligand.ApprovedSymbol | Ligand.Name | Receptor.ApprovedSymbol | Receptor.Name | DLRP | HPMR | IUPHAR | HPRD | STRING.binding | STRING.experiment | HPMR.Ligand | HPMR.Receptor | PMID.Manual | Pair.Source | Pair.Evidence | |
|---|---|---|---|---|---|---|---|---|---|---|---|---|---|---|---|---|
| 0 | A2M_LRP1 | A2M | alpha-2-macroglobulin | LRP1 | low density lipoprotein receptor-related prote... | NaN | HPMR | NaN | HPRD | STRING.binding | STRING.experiment | A2M | LRP1 | NaN | known | literature supported |
| 1 | AANAT_MTNR1A | AANAT | aralkylamine N-acetyltransferase | MTNR1A | melatonin receptor 1A | NaN | HPMR | NaN | NaN | NaN | NaN | AANAT | MTNR1A | NaN | known | literature supported |
| 2 | AANAT_MTNR1B | AANAT | aralkylamine N-acetyltransferase | MTNR1B | melatonin receptor 1B | NaN | HPMR | NaN | NaN | NaN | NaN | AANAT | MTNR1B | NaN | known | literature supported |
| 3 | ACE_AGTR2 | ACE | angiotensin I converting enzyme | AGTR2 | angiotensin II receptor, type 2 | NaN | NaN | NaN | HPRD | NaN | NaN | ACE | AGTR2 | NaN | novel | literature supported |
| 4 | ACE_BDKRB2 | ACE | angiotensin I converting enzyme | BDKRB2 | bradykinin receptor B2 | NaN | NaN | NaN | HPRD | NaN | NaN | ACE | BDKRB2 | NaN | novel | literature supported |
# Let's explore the existing known interactions

# filter out interactions labeled as "EXCLUDED"
df = df.loc[
    ~df['Pair.Evidence'].str.contains("EXCLUDED"),
    ['Pair.Name', 'Ligand.ApprovedSymbol', 'Receptor.ApprovedSymbol']]
df.columns = ['pair', 'ligand', 'receptor']
df['interaction'] = 1
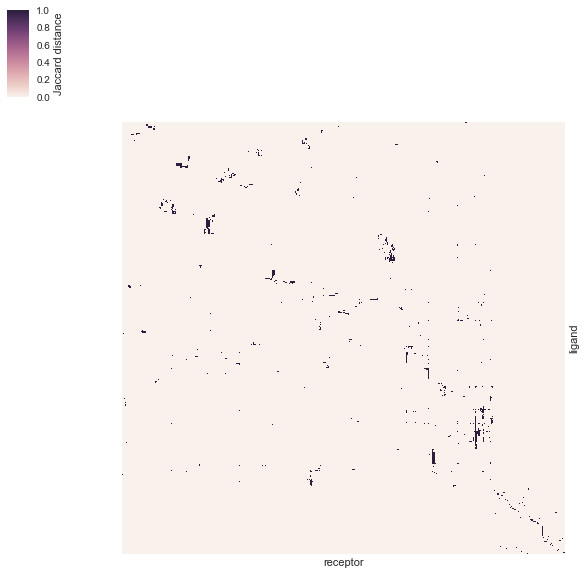
# Let's make a pivot table of receptor vs ligands
df_pivot = pd.pivot_table(data=df, index="ligand", columns='receptor', aggfunc=sum, fill_value=0)

# Heatmap
g = sns.clustermap(
    df_pivot, xticklabels=False, yticklabels=False, metric="jaccard",
    rasterized=True, cbar_kws={"label": "Jaccard distance"})
g.ax_row_dendrogram.set_visible(False)
g.ax_col_dendrogram.set_visible(False)
g.ax_heatmap.set_xlabel("receptor")
g.savefig(os.path.join("human_receptor_ligand.interaction_map.clustermap.svg"), bbox_inches="tight", dpi=300)
/home/afr/.local/lib/python3.5/site-packages/matplotlib/cbook.py:136: MatplotlibDeprecationWarning: The axisbg attribute was deprecated in version 2.0. Use facecolor instead.
  warnings.warn(message, mplDeprecation, stacklevel=1)
# Let's now play with the expression of these genes in tissues
df = pd.read_excel(
    "https://images.nature.com/original/nature-assets/ncomms/2015/150722/ncomms8866/extref/ncomms8866-s5.xlsx",
    1, index_col=[0, 1, 2])
df.head()

# remove not expressed genes in any tissue
df = df[~(df.sum(1) == 0)]
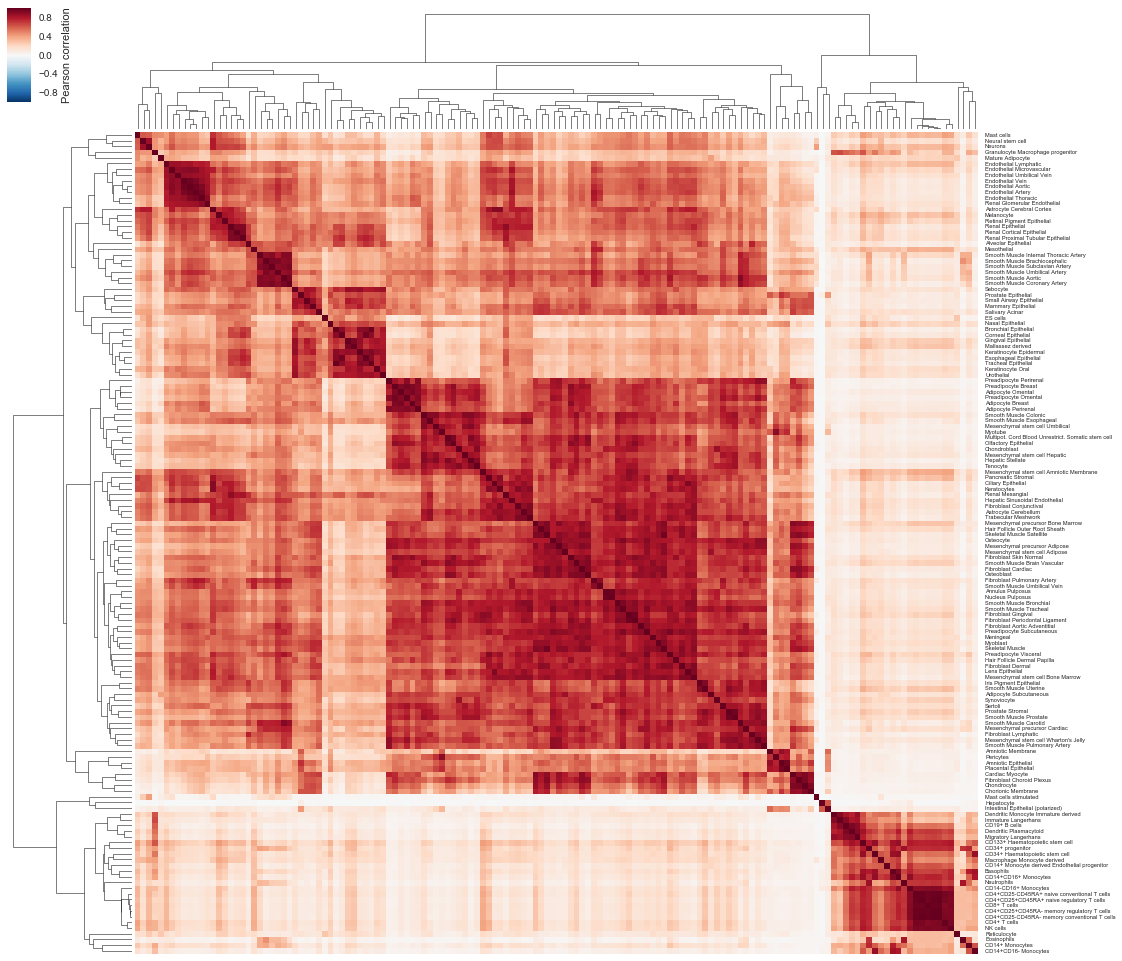
# Let's correlate tissues in the expression of these genes
w, h = df.shape[1] * 0.12, df.shape[1] * 0.12
g = sns.clustermap(
    df.corr(), xticklabels=False, figsize=(w, h), cbar_kws={"label": "Pearson correlation"})
g.ax_heatmap.set_yticklabels(g.ax_heatmap.get_yticklabels(), rotation=0, fontsize="xx-small", rasterized=True)
g.ax_row_dendrogram.set_rasterized(True)
g.ax_col_dendrogram.set_rasterized(True)
g.savefig(
    os.path.join("human_receptor_ligand.expression.tissue_correlation.clustermap.svg"),
    bbox_inches="tight", dpi=300)
/home/afr/.local/lib/python3.5/site-packages/matplotlib/cbook.py:136: MatplotlibDeprecationWarning: The axisbg attribute was deprecated in version 2.0. Use facecolor instead.
  warnings.warn(message, mplDeprecation, stacklevel=1)
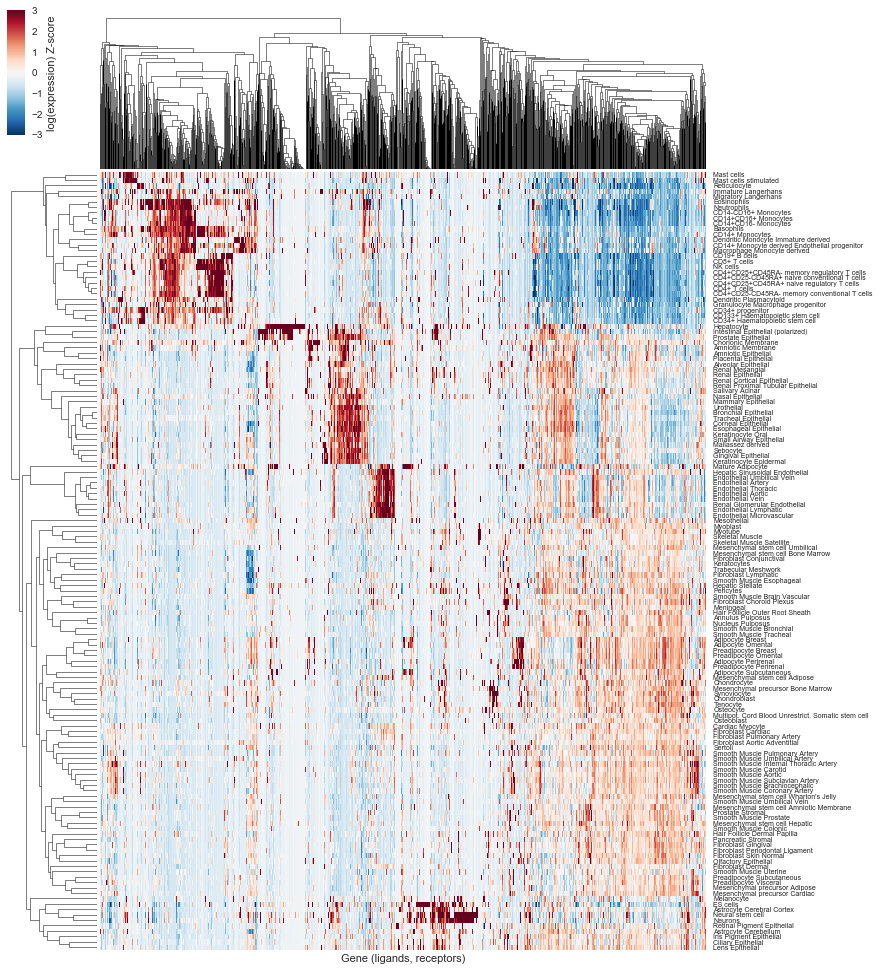
# Let's visualize the expression ligand and receptors in the different tissues
df2 = np.log2(1 + df.drop("F5.PrimaryCells.Expression_Max", axis=1).dropna())

w, h = df2.shape[1] * 0.12, df2.shape[0] * 0.01
g = sns.clustermap(df2.T, metric="correlation", z_score=1, vmin=-3, vmax=3,
                   figsize=(h, w), cbar_kws={"label": "log(expression) Z-score"}, xticklabels=False, rasterized=True)
g.ax_heatmap.set_yticklabels(g.ax_heatmap.get_yticklabels(), rotation=0, fontsize="x-small")
g.ax_row_dendrogram.set_rasterized(True)
g.ax_col_dendrogram.set_rasterized(True)
g.ax_heatmap.set_xlabel("Gene (ligands, receptors)")
g.savefig(os.path.join("human_receptor_ligand.expression.clustermap.svg"), bbox_inches="tight", dpi=300)
/home/afr/.local/lib/python3.5/site-packages/matplotlib/cbook.py:136: MatplotlibDeprecationWarning: The axisbg attribute was deprecated in version 2.0. Use facecolor instead.
  warnings.warn(message, mplDeprecation, stacklevel=1)